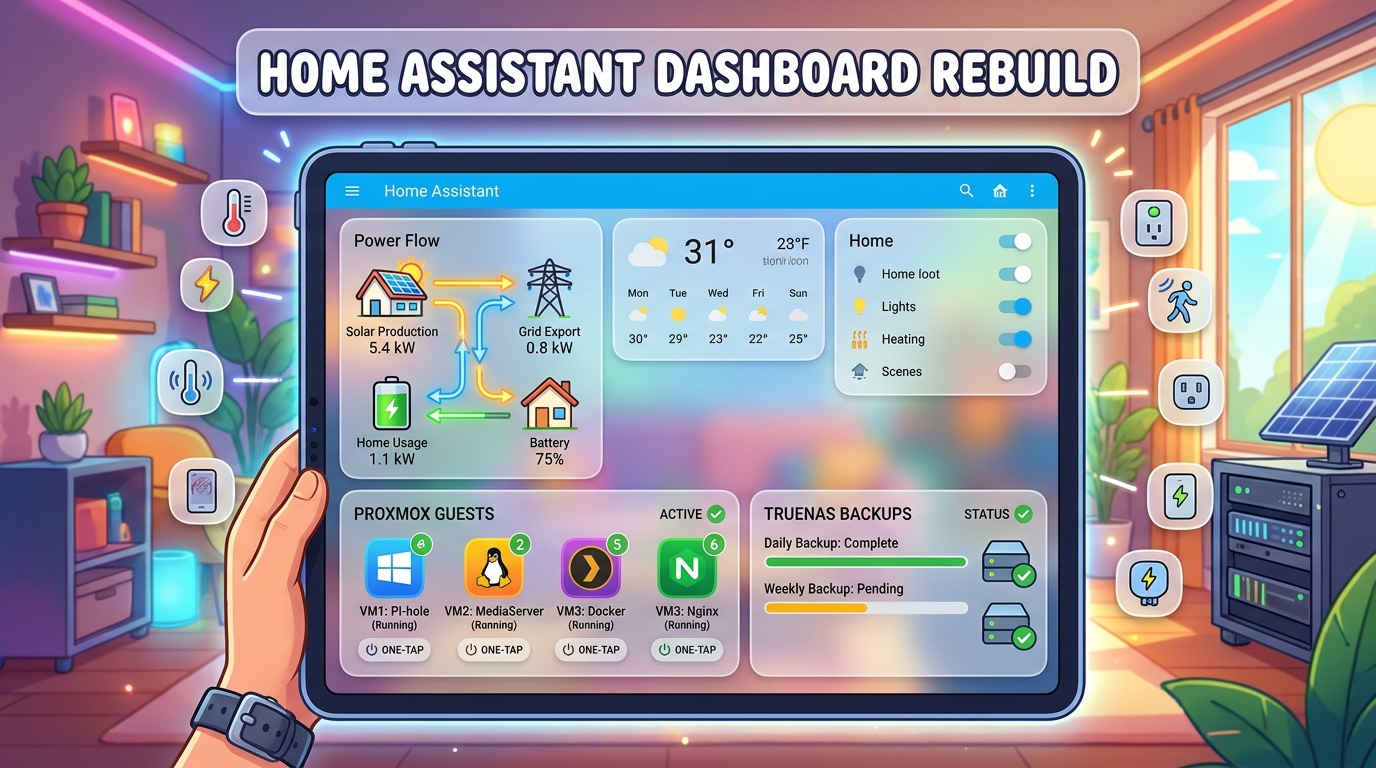
My Home Assistant dashboard had been the same for ages: a row of navigation buttons, a pile of default tiles, and a separate tab for every topic. It worked, but it was flat, grey and needed three taps to find anything. I finally sat down and rebuilt it from scratch: one dashboard for desktop, one for mobile, a frosted-glass theme, a proper solar energy view, and full Proxmox and TrueNAS control pages with live stats and start/stop buttons.
This post walks through the whole thing, including the parts that broke along the way, so you can steal what’s useful for your own setup.
What I wanted
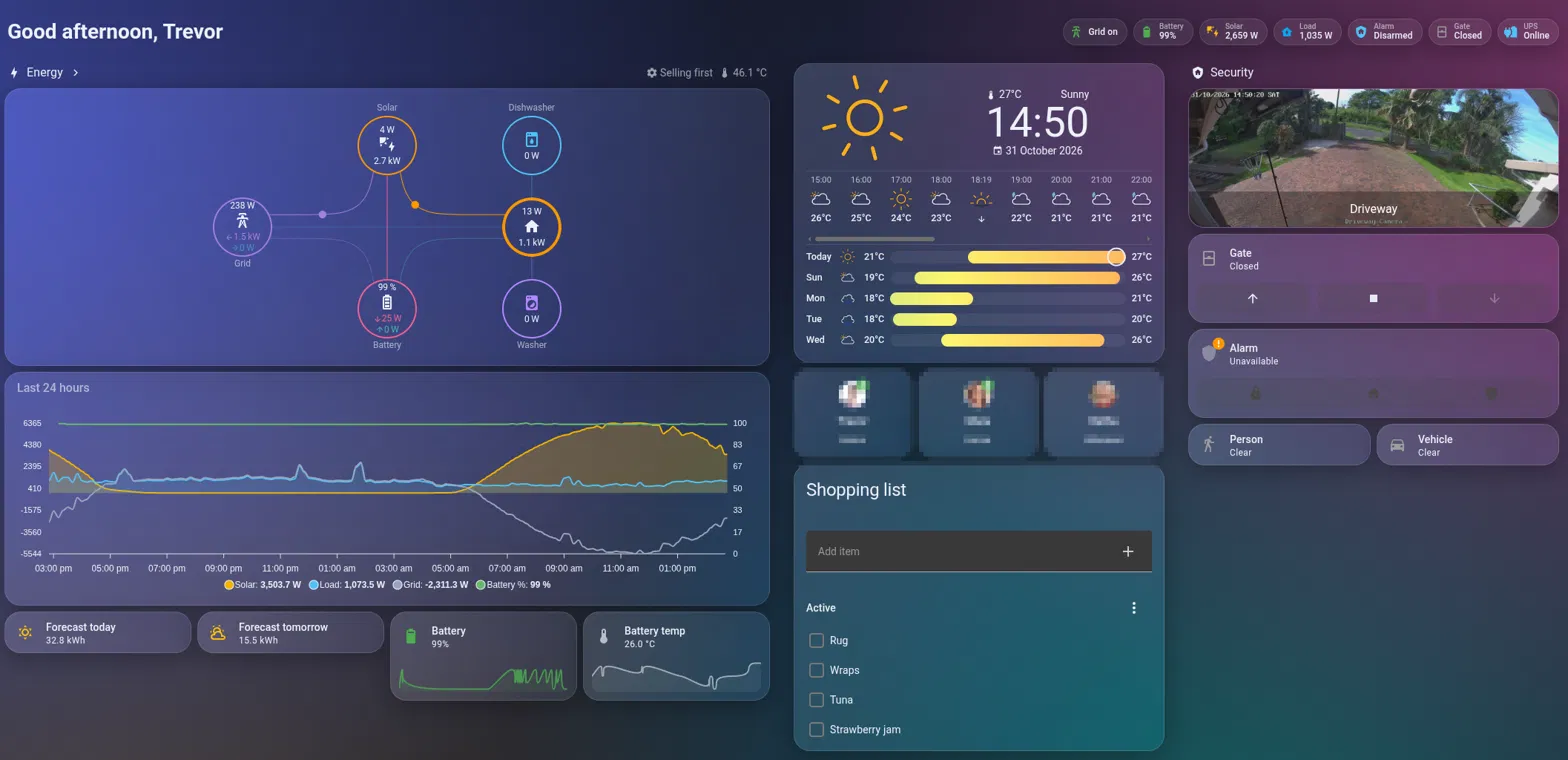
- Energy front and centre. I run a Deye hybrid inverter with batteries and solar, and load shedding is a fact of life here. Grid status, battery and solar should be visible the moment I open the app.
- Separate desktop and mobile layouts. A 4-column desktop view squashed onto a phone is never great.
- A glassy look, like the reference dashboards everyone posts on Reddit.
- A Lab section where I can see my Proxmox node and every LXC/VM, and start, stop or reboot them without opening the Proxmox UI.
- TrueNAS health and backups at a glance, so I know the offsite syncs actually ran.
What you need
Everything here uses the built-in Sections view and tile cards, plus four HACS frontend cards:
- Power Flow Card Plus: the animated solar / battery / grid / home flow diagram
- ApexCharts Card: the 24-hour energy graph
- Clock Weather Card: big clock with hourly and daily forecast
- Lovelace Card Mod: needed for the frosted-glass blur
And these integrations for the data:
- Your inverter integration (mine comes in over MQTT from Solar Assistant)
- Forecast.Solar for today’s and tomorrow’s production forecast
- Proxmox VE Custom (HACS) for node and guest stats plus the start/stop buttons
- A TrueNAS integration (more on which one later, because the obvious one didn’t work)
Step 1: The frosted-glass theme
The glass effect needs two ingredients: semi-transparent cards with a backdrop blur, and something colourful behind them to blur. Glass on a flat dark background just looks grey. Themes can’t do blur on their own, which is why card-mod is needed.
First, load card-mod early and tell Home Assistant where your themes live in configuration.yaml:
frontend:
  extra_module_url:
    - /hacsfiles/lovelace-card-mod/card-mod.js
  themes: !include_dir_merge_named themes
Then create themes/midnight.yaml. The background is four soft radial-gradient “light blobs” over a dark navy, and card-mod applies the blur to every card from the theme, so you never have to touch individual cards:
Midnight:
  card-mod-theme: Midnight
  lovelace-background: >-
    radial-gradient(circle at 12% 18%, rgba(88, 101, 242, 0.55) 0%, transparent 38%),
    radial-gradient(circle at 85% 12%, rgba(236, 72, 153, 0.40) 0%, transparent 35%),
    radial-gradient(circle at 70% 85%, rgba(20, 184, 166, 0.40) 0%, transparent 40%),
    radial-gradient(circle at 20% 90%, rgba(245, 180, 0, 0.22) 0%, transparent 35%),
    linear-gradient(160deg, #0b1020 0%, #141a35 50%, #0b1020 100%) fixed
  primary-background-color: "#0b1020"
  card-background-color: "rgba(255, 255, 255, 0.06)"
  ha-card-background: "rgba(255, 255, 255, 0.06)"
  ha-card-border-radius: "22px"
  ha-card-border-width: "1px"
  ha-card-border-color: "rgba(255, 255, 255, 0.12)"
  ha-card-box-shadow: "0 8px 32px rgba(0, 0, 0, 0.30)"
  ha-badge-background-color: "rgba(255, 255, 255, 0.08)"
  primary-color: "#4fc3f7"
  accent-color: "#f5b400"
  primary-text-color: "#eef1f8"
  secondary-text-color: "rgba(238, 241, 248, 0.62)"
  card-mod-card: |
    ha-card {
      backdrop-filter: blur(18px) saturate(160%);
      -webkit-backdrop-filter: blur(18px) saturate(160%);
      background-image: linear-gradient(135deg, rgba(255,255,255,0.10) 0%, rgba(255,255,255,0.02) 100%);
    }
Gotcha: the
themesfolder is relative toconfiguration.yaml. In the File editor add-on that’s/homeassistant/themes/, not/homeassistant/config/themes/. I put it in the wrong place first and got “No themes available” in my profile with no error anywhere. If your theme doesn’t show up in the profile Theme dropdown, check the folder before anything else.
Restart once after adding the frontend: block. After that, theme edits only need Tools → YAML → Themes reload. Each dashboard view sets theme: Midnight, so the rest of the HA UI keeps its normal look. If blur stutters on an older phone, drop it to 10px.
Step 2: Two dashboards, one per device
I created two new dashboards from scratch: Home (desktop) and Home Mobile. Both use the Sections view type. Desktop allows up to four columns with dense_section_placement so sections pack tightly. Mobile is pinned to one column with max_columns: 1.
To make each device open the right one, go to Profile → Browser settings → Dashboard on each device and pick the matching dashboard. It’s a per-browser setting, so your phone and PC can each have their own default.
Step 3: The header and status badges
The view header shows a time-aware greeting using a markdown card with a template, and a row of badges underneath:
header:
  layout: responsive
  badges_position: bottom
  card:
    type: markdown
    text_only: true
    content: >-
      # {% set h = now().hour %}{{ 'Good morning' if 5 <= h < 12 else 'Good afternoon' if 12 <= h < 18 else 'Good evening' }}, {{ user }}
The most useful badge is the grid status. It’s actually two badges on the same binary sensor with opposite visibility conditions: a green “Grid on” and a red “Grid down” with a different icon. Only one is ever visible, and tapping either one opens the Energy dashboard:
- type: entity
  entity: binary_sensor.inverter_grid_available
  name: Grid
  show_name: true
  icon: mdi:transmission-tower
  color: green
  tap_action:
    action: navigate
    navigation_path: /energy
  visibility:
    - condition: state
      entity: binary_sensor.inverter_grid_available
      state: "on"
- type: entity
  entity: binary_sensor.inverter_grid_available
  name: Grid
  show_name: true
  icon: mdi:transmission-tower-off
  color: red
  tap_action:
    action: navigate
    navigation_path: /energy
  visibility:
    - condition: state
      entity: binary_sensor.inverter_grid_available
      state_not: "on"
On mobile I also moved the family’s person entities into small photo badges instead of three big tiles, which saved almost a full screen of scrolling.
Step 4: The energy section
This is the part I’m happiest with. Power Flow Card Plus shows live flow between solar, grid, battery and the house, with the dishwasher and washing machine smart plugs as extra bubbles. The power_outage option makes the grid circle switch to an alert state during load shedding.
- type: custom:power-flow-card-plus
  watt_threshold: 1000
  kw_decimals: 2
  clickable_entities: true
  display_zero_lines:
    mode: transparency
    transparency: 60
  entities:
    grid:
      entity: sensor.inverter_grid_power
      color_circle: true
      power_outage:
        entity: binary_sensor.inverter_grid_available
        state_alert: "off"
        label_alert: Grid down
    solar:
      entity: sensor.inverter_pv_power
      display_zero_state: true
    battery:
      entity: sensor.inverter_battery_power
      state_of_charge: sensor.inverter_battery_soc
      invert_state: true
      color_circle: true
    home:
      entity: sensor.inverter_load_power
    individual:
      - entity: sensor.dishwasher_power
        name: Dishwasher
        icon: mdi:dishwasher
      - entity: sensor.washing_machine_power
        name: Washer
        icon: mdi:washing-machine
If your battery arrows point the wrong way (charging when it’s discharging), remove
invert_state: true. Inverters disagree on the sign convention.
Below that, an ApexCharts card shows the last 24 hours: solar and load as filled areas, grid as a line (negative means exporting), and battery state of charge on a second 0–100 axis. Grouping into 10-minute averages keeps it smooth and fast to load.
- type: custom:apexcharts-card
  graph_span: 24h
  header:
    show: true
    title: Last 24 hours
  all_series_config:
    stroke_width: 2
    group_by:
      func: avg
      duration: 10min
  yaxis:
    - id: power
      decimals: 0
    - id: soc
      opposite: true
      min: 0
      max: 100
  series:
    - entity: sensor.inverter_pv_power
      name: Solar
      type: area
      opacity: 0.25
      color: "#f5b400"
      yaxis_id: power
    - entity: sensor.inverter_load_power
      name: Load
      type: area
      opacity: 0.15
      color: "#4fc3f7"
      yaxis_id: power
    - entity: sensor.inverter_grid_power
      name: Grid
      color: "#9aa4bf"
      yaxis_id: power
    - entity: sensor.inverter_battery_soc
      name: Battery %
      color: "#66bb6a"
      yaxis_id: soc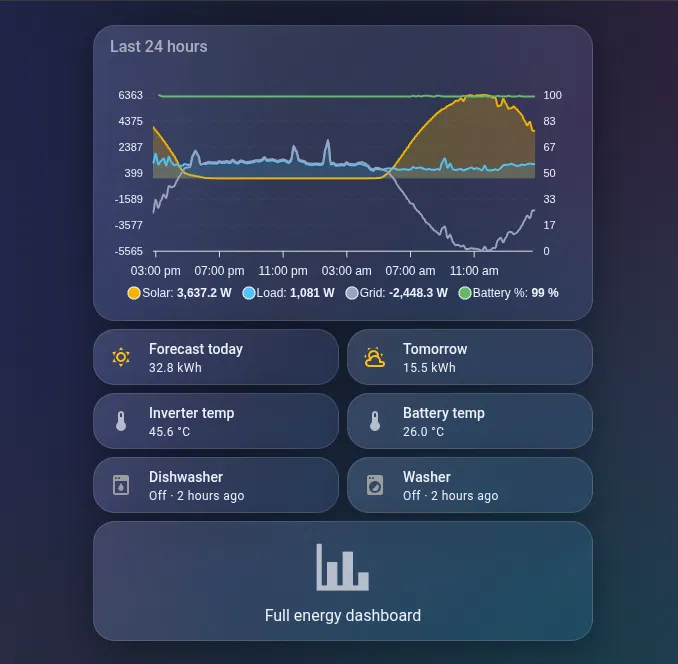
Forecast.Solar tiles for today and tomorrow and a couple of trend-graph tiles for battery level and temperature round it off.
Step 5: A mobile layout that makes sense
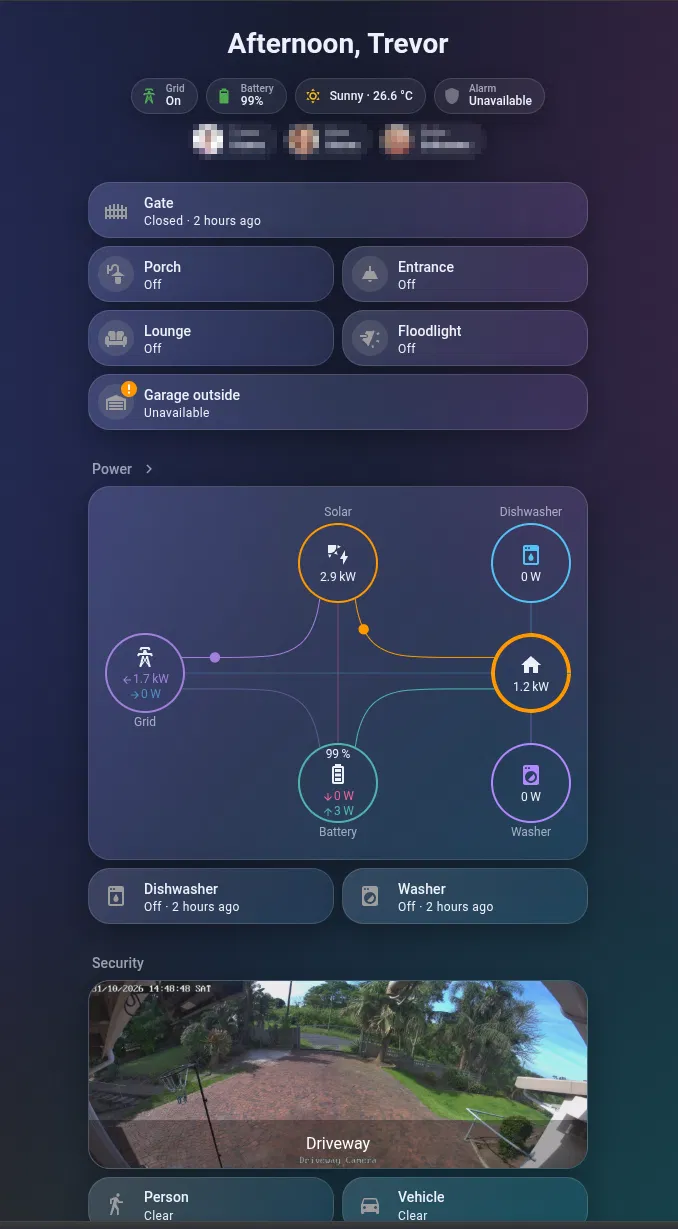
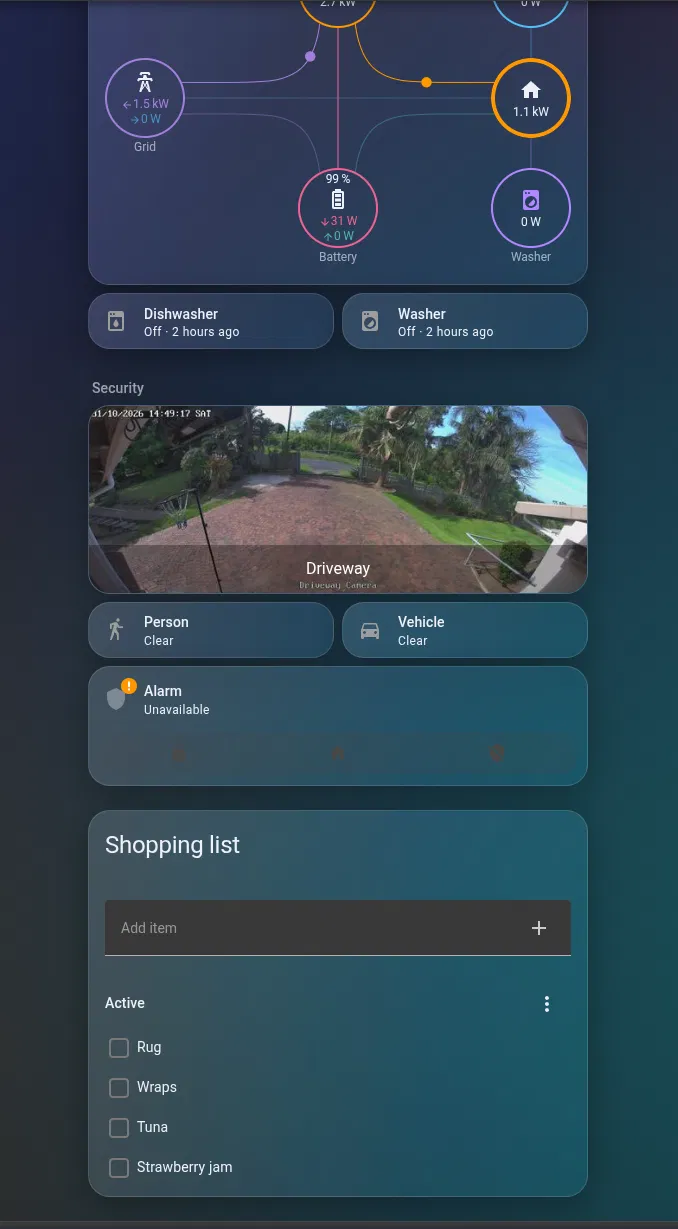
For the phone I ordered things by how often I actually reach for them:
- Badges: grid, battery, weather, alarm, people
- Gate and lights: the things I tap most
- Power: the flow card, with appliance status underneath
- Security: driveway camera, person/vehicle detection, alarm
- Now playing: media controls that only appear when a TV is actually on
- Shopping list at the bottom
The gate was a tile with three open/stop/close buttons, which was overkill. Now it’s a single full-width button that toggles, shows how long ago it last moved, and asks for confirmation so a pocket-tap can’t open it:
- type: tile
  entity: cover.main_gate
  name: Gate
  icon: mdi:gate
  color: red
  state_content:
    - state
    - last_changed
  tap_action:
    action: toggle
    confirmation:
      text: Open/close the gate?
  grid_options:
    columns: full
Tiles only colour the “active” state, so it’s grey when closed and red when open, which is exactly what you want to notice at a glance.
Step 6: The Lab tab and a Proxmox control page
The Lab tab shows the Proxmox node (CPU, RAM, disk, and node-wide Start all / Stop all / Reboot / Shutdown), a Guests card with running LXC and VM counts, and a server room section with UPS, HA backup status and AdGuard. Tapping the guest counts opens a dedicated Proxmox page.
That page is a subview: it doesn’t get its own tab, but it does get a back arrow. Each guest gets a section with status and last boot in the heading, CPU and RAM trend graphs, disk usage, and four action buttons:
- type: tile
  entity: button.lxc_myguest_120_reboot
  name: Reboot
  icon: mdi:restart
  color: blue
  hide_state: true
  vertical: true
  grid_options:
    columns: 3
  tap_action:
    action: perform-action
    perform_action: button.press
    target:
      entity_id: button.lxc_myguest_120_reboot
    confirmation:
      text: Reboot myguest?
  hold_action:
    action: more-info
Every button asks for confirmation, because rebooting the container running your reverse proxy by accident is not a fun way to find out you forgot one. Linking to the page is just a navigate action:
tap_action:
  action: navigate
  navigation_path: /home-mobile/proxmox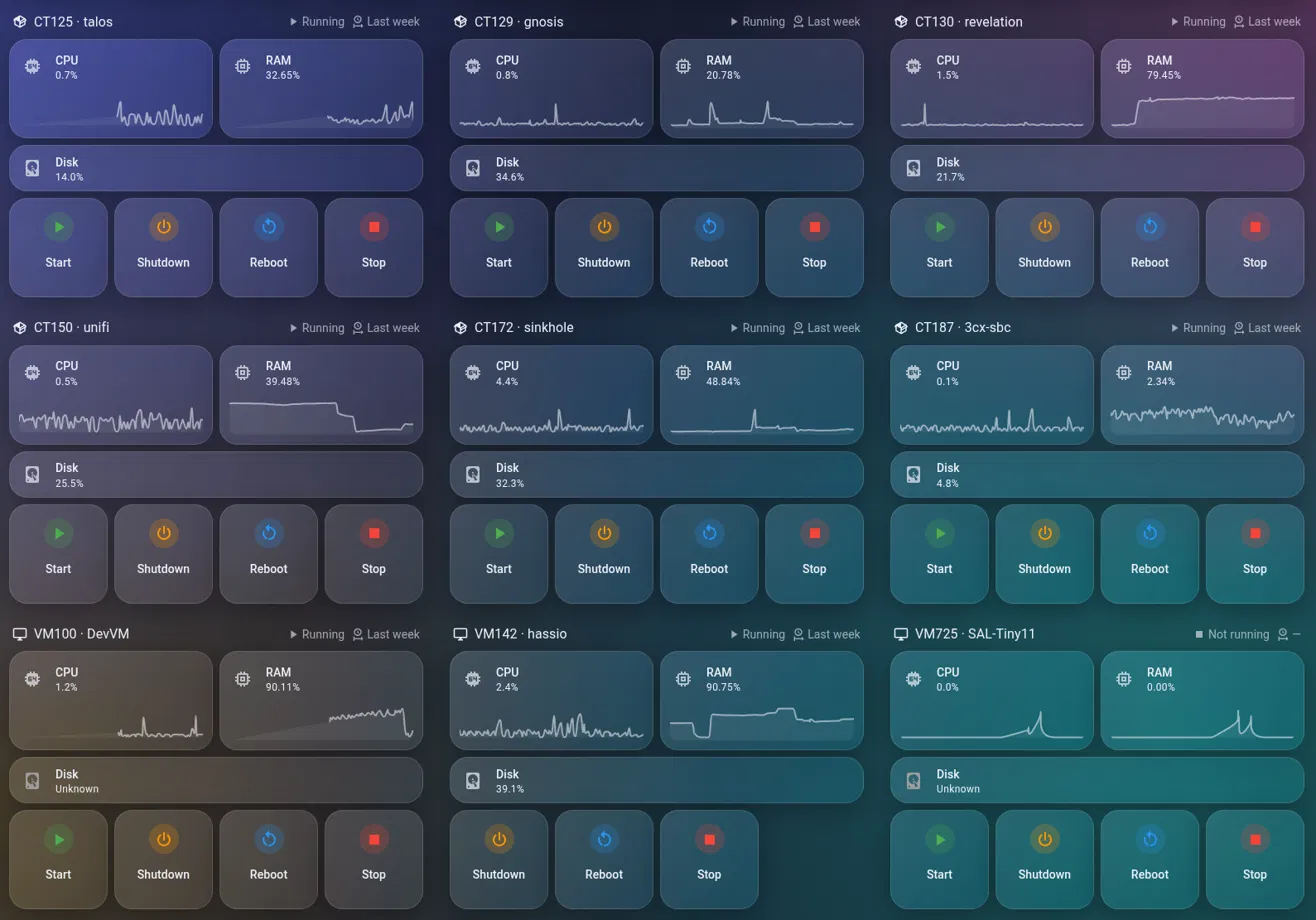
Tidy your entity IDs first. Home Assistant generates entity IDs once and never updates them when you rename a guest in Proxmox. Half of mine were still named after what the containers used to be. Fix it in Settings → Entities: search for the old name, select all, then ⋮ → Recreate entity IDs. History is kept, but anything that referenced the old IDs (dashboards, automations) needs updating, so do it before you build the dashboard, not after.
Also check each guest’s device page for disabled entities. Guests added after the integration was set up often have their CPU, RAM and disk sensors disabled by default. And VMs only report disk usage if the QEMU guest agent is installed and enabled. Without it, disk shows “Unknown”.
Step 7: TrueNAS
The obvious HACS integration for TrueNAS connected and then immediately failed with “Failed setup, will retry: TrueNAS Disconnected” and 400 errors on reporting/get_data and disk/temperatures. Newer TrueNAS releases (I’m on 25.10) have moved away from the old REST API that integration was built on.
The fix was the maintained fork, listed in HACS as Homeassistant Truenas (“TrueNAS Community Edition integration for Home Assistant, requires TrueNAS 25.04+”). Remove the old one first, install the fork, restart, and add it with your NAS IP and an API key.
Don’t use an API key tied to your admin account. Create a dedicated user instead:
- Credentials → Users → Add: a
homeassistantuser with password login disabled, no shell and no SMB access - Credentials → Groups → Add: a group with that user in it
- Credentials → Groups → Privileges: add the group to Read-Only Administrator
- Create the API key for that user and use it in Home Assistant
Read-only is enough for all the monitoring. You only need write privileges if you want the dashboard to start scrubs or run backup tasks.
The integration exposes a lot: pool health, usage, scrub status, disk temperatures, app status with CPU/RAM, and, most usefully, the status of every Cloud Sync, rsync and snapshot task, each with a Run button. The Lab tab gets a small TrueNAS summary (CPU, RAM, pool health, the two most important offsite syncs), and tapping it opens a full TrueNAS page:
- System: CPU, RAM, temperature, ZFS ARC, network, all with trends
- Pools: health, used and free space, errors, fragmentation, last scrub (tap to start one)
- Disk temps for each drive
- Offsite backups: every Cloud Sync task with status and last run. Tap runs it now, hold shows details
- Rsync and snapshots, same pattern
- Apps and containers with resource usage and pending updates
- Services (SMB, NFS, UPS, SSH) as read-only tiles, so I can’t switch off NFS by accident
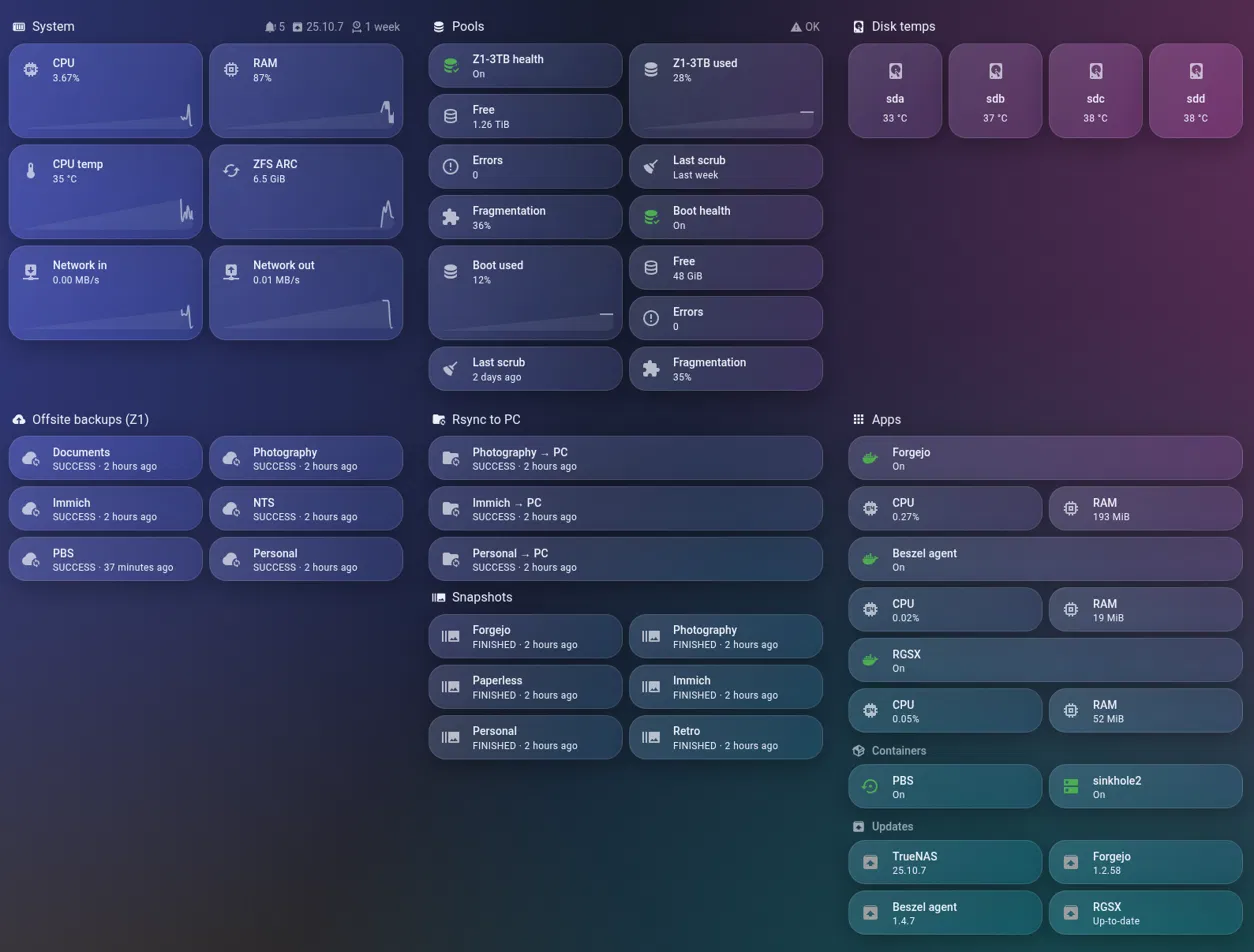
Don’t panic if TrueNAS RAM sits around 85–90%. Most of it is ZFS ARC (read cache), and it gets released when apps need memory. The ARC tile next to it makes that obvious.
Bonus: are my appliance kWh numbers right?
While adding the appliance plugs to the energy view, the totals looked off: the dishwasher had used over 400 kWh and the washing machine only about 25 kWh. The kWh values come from Integral helpers on the plugs’ power sensors, and a few things are worth knowing:
- Use Left Riemann sum, not Trapezoidal, for anything that switches hard between off and full power: heaters, kettles, dishwashers. Trapezoidal assumes power ramps smoothly between readings and over-counts those jumps.
- Set a max sub-interval of about 5 minutes. Plugs often stop reporting while power is steady, and this keeps the counter ticking instead of stalling and then jumping.
- Sanity-check against the history graph. Putting both plugs on one history graph settled it: the dishwasher showed clean ~2 kW heating spikes about once a day (about 1.2 kWh per cycle, so 400 kWh over a year is right), while the washer peaked at ~200 W, meaning cold washes with no heater. Both numbers were correct.
A nice side effect: the same graph showed the dishwasher mostly running late at night. Shifting it to midday would run it almost entirely on solar.
Gotchas, collected
- Custom cards showing “Configuration error” right after installing usually just need a hard refresh (Ctrl+Shift+R), or Reset frontend cache in the companion app.
- “No themes available” means HA isn’t finding your themes folder. Check its location relative to
configuration.yaml. - When pasting YAML into the raw config editor, match the editor’s indentation exactly. Sections sit 6 spaces in, views 2. “Bad indentation of a sequence entry” almost always means a block is 2 spaces off.
- Subviews need a link to them. Put a
navigatetap action on a badge, heading or tile. - Glass needs a colourful background. If it looks grey, the background is the problem, not the blur.
Wrapping up
The whole rebuild took one long evening and a bit of the next afternoon, most of it on the TrueNAS integration and indentation errors rather than design. The result is a dashboard I actually want to open: energy and grid status the moment it loads, everything I tap daily within thumb reach on the phone, and the homelab one tap away instead of buried in another app.
If you build something similar, I’d love to see it. And if you’re running TrueNAS 25.10 and stuck on “Disconnected”, hopefully this saved you an hour.
Leave a Reply