TL;DR
I wanted a simple, readable list of what CrowdSec was blocking, without paying for the CrowdSec Console or living inside cscli. So I added crowdsec-web-ui, a free self-hosted dashboard, to my existing NPMPlus + CrowdSec stack. It runs on loopback only, sits behind Cloudflare Tunnel and Access, and pings my phone through ntfy when something interesting happens.
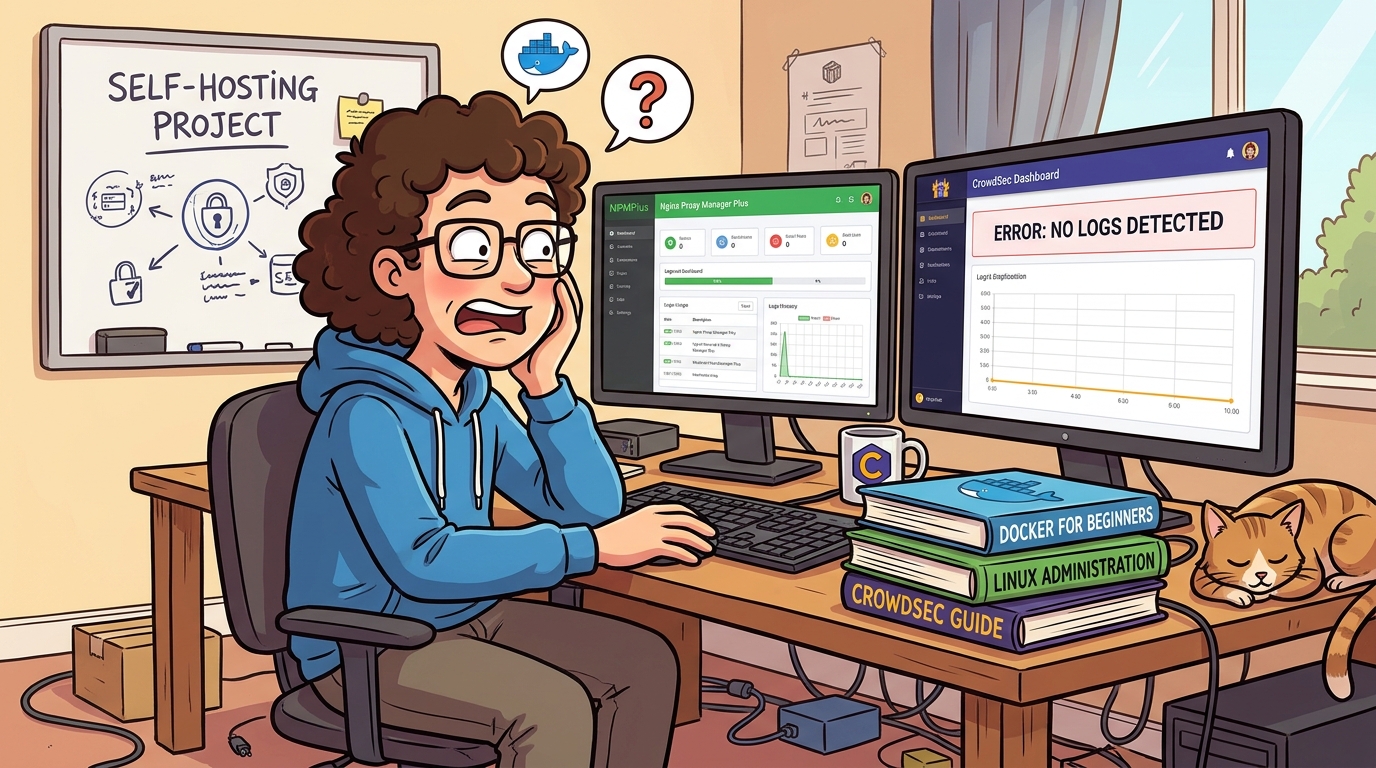
The bigger win came while I was checking everything worked. CrowdSec had never been reading my NPMPlus access logs: a wrong path in the acquisition config meant only the WAF side was doing anything. One sed later, half my detection switched back on. If you followed my NPMPlus migration walkthrough, check yours (section below).
Why Bother?
CrowdSec is great at its job and terrible at telling you about it. It quietly bans scanners and blocks exploit attempts, and unless you go looking, you never see any of it.
The official answer is the CrowdSec Console, and it’s genuinely nice. On the free Community plan, though, there’s a monthly alert quota, and on a public-facing reverse proxy you burn through it fast. Local blocking keeps working when you hit it; you just lose the visibility, which was the whole point.
The other answer is cscli:
docker exec crowdsec cscli decisions list
docker exec crowdsec cscli alerts list
It works, but it’s a wall of terminal output. When I got blocked by my own CrowdSec migrating a WordPress site, cscli decisions list told me I wasn’t banned. It didn’t tell me what was happening.
What I wanted:
- Alerts and bans in a browser: with the attacker IP, country, ASN, scenario and target host.
- Unban from the UI: remove a ban (or add one) without a terminal.
- Notifications: pushed to ntfy, which I already run.
- Free and self-hosted: no new subscription, no data leaving my lab.
crowdsec-web-ui by TheDuffman85 ticks every box. It talks to CrowdSec’s Local API (LAPI) and keeps its own SQLite history, with:
- a dashboard with an attack map
- a searchable alert history
- decision management
- a Prometheus metrics view
- notification rules
- proper authentication (local accounts, TOTP, passkeys, OIDC)
Note: If you read older guides saying this project has no authentication, they’re out of date. Current versions start with an admin setup page and support TOTP and passkeys.
What You’ll End Up With
- The dashboard: crowdsec-web-ui running in the same Docker stack as NPMPlus and CrowdSec.
- A private network: CrowdSec and the UI share their own Docker network; no new ports are reachable on your LAN.
- Protected access: the UI behind Cloudflare Tunnel + Cloudflare Access, plus its own login with TOTP.
- Alerts on your phone: ntfy notifications for the things worth knowing about.
- Possibly, a fixed CrowdSec: if your log acquisition is broken like mine was.
Prerequisites
- An NPMPlus + CrowdSec stack: like the one from my migration walkthrough. NPMPlus on host networking, CrowdSec in its own container with its LAPI published on
127.0.0.1:8080. - Dockge or plain Docker Compose: I use Dockge, with stacks under
/opt/stacks/. - Optional, for remote access: a Cloudflare Tunnel and Cloudflare Access. I covered my setup in One Night, 63,000 Spam Accounts, and Closing My Homelab’s Front Door, so I won’t repeat it here.
Where Should the Dashboard Live?
My first instinct was to put it on the LXC where all my monitoring lives, next to Uptime Kuma and Beszel. One place for dashboards feels tidy. I talked myself out of it, and put it in the same Compose stack as NPMPlus and CrowdSec instead.
- It’s useless without CrowdSec. If the proxy host goes down, a dashboard elsewhere just shows “LAPI unreachable”. You don’t gain any availability, and Uptime Kuma already tells me when that host dies.
- Nothing new on the network. Running it elsewhere means publishing the LAPI (port 8080) and the metrics endpoint (port 6060) on the LAN. The metrics endpoint has no authentication. In the same stack, both stay private.
- Fewer moving parts. CrowdSec only lets trusted IPs delete alerts, and across hosts, Docker’s NAT can make the source IP something you didn’t expect. Inside one Docker network, it’s predictable.
- It’s part of the proxy. It’s the admin console for my edge security, the same way NPMPlus’s own admin UI lives with NPMPlus.
So the dashboard lives and dies with CrowdSec, which is exactly the relationship it has anyway.
[Image placeholder: diagram of the request path. Browser → Cloudflare Tunnel → NPMPlus → crowdsec-web-ui on 127.0.0.1:3000 → CrowdSec LAPI over a private Docker network]
Step 1: Back Up
You’re about to move CrowdSec onto a new network and change its config. Take thirty seconds to make undo easy. From your stack folder (mine is /opt/stacks/npmplus-crowdsec):
cp compose.yaml compose.yaml.bak-$(date +%F)
cp -a crowdsec/conf crowdsec/conf.bak-$(date +%F)
While you’re there, check nothing already uses port 3000, and that the subnet I’m about to use (172.30.30.0/24) is free:
ss -tlnp | grep ':3000 '
docker network inspect $(docker network ls -q) --format '{{.Name}} {{range .IPAM.Config}}{{.Subnet}}{{end}}'- Port check: the first command should print nothing.
- Subnet check: if
172.30.30.shows up in the second, pick another private range and use it everywhere below.
Step 2: Prepare the UI’s Data Folder
The container runs as the non-root node user (UID 1000). If root owns the bind-mounted folder, the UI can’t write its SQLite database. Create the folder and hand it over first:
mkdir -p crowdsec-web-ui/data
chown -R 1000:1000 crowdsec-web-ui/data
Step 3: Generate a Password and Use .env
The UI logs in to CrowdSec’s LAPI as a machine, the same way a CrowdSec agent does. It needs a password:
openssl rand -hex 32Save it in your password manager, then put it in the stack’s .env file (in Dockge, it’s the box under the compose editor) rather than in compose.yaml. I moved the timezone and ACME email in there too, since they were repeated across services:
TZ=Africa/Johannesburg
[email protected]
CROWDSEC_LAPI_PASSWORD=paste-the-generated-password-here
Step 4: Tell CrowdSec to Trust the UI and Expose Metrics
Create crowdsec/conf/config.yaml.local. CrowdSec merges this over its main config.yaml, so you never have to edit the shipped file:
api:
  server:
    trusted_ips:
      - 127.0.0.1
      - ::1
      - 172.30.30.0/24
prometheus:
  enabled: true
  level: full
  listen_addr: 0.0.0.0
  listen_port: 6060
What each part does:
trusted_ips: CrowdSec only allows alert deletion from loopback or an address in this list. Being a registered machine isn’t enough. Without it, bans still work, but deleting an alert from the UI returns403 Forbidden.prometheus: turns on full metrics and makes them listen inside the container, so the UI’s Metrics page can read them. Port 6060 is never published on the host, so the endpoint isn’t reachable from your LAN.
Important: In a
.localfile, lists replace the original list instead of adding to it. That’s why127.0.0.1and::1are repeated. Leave them out and you’ve quietly removed them.
Pitfall: You’ll see guides suggesting a
TRUSTED_IPSenvironment variable on the CrowdSec container. It doesn’t exist.config.yaml.localis the way to do it.
Step 5: Update the Compose File
Three changes:
- CrowdSec moves off Docker’s default bridge onto a dedicated stack network.
- The new
crowdsec-web-uiservice joins that network. - The network gets a fixed subnet so
trusted_ipsstays valid when containers are recreated.
Here’s my full file:
name: npmplus-crowdsec
services:
  npmplus:
    container_name: npmplus
    image: docker.io/zoeyvid/npmplus:latest
    restart: unless-stopped
    network_mode: host
    volumes:
      - ./npmplus-data:/data
    environment:
      - TZ=${TZ}
      - ACME_EMAIL=${ACME_EMAIL}
      - LOGROTATE=true
      - TRUST_CLOUDFLARE=true

  crowdsec:
    container_name: crowdsec
    image: docker.io/crowdsecurity/crowdsec:latest
    restart: unless-stopped
    networks:
      - crowdsec
    ports:
      - 127.0.0.1:7422:7422 # AppSec for NPMPlus
      - 127.0.0.1:8080:8080 # LAPI for the NPMPlus bouncer
    environment:
      - TZ=${TZ}
      - USE_WAL=true
      - COLLECTIONS=ZoeyVid/npmplus
    volumes:
      - ./crowdsec/conf:/etc/crowdsec
      - ./crowdsec/data:/var/lib/crowdsec/data
      - ./npmplus-data/nginx/logs:/opt/npmplus/nginx/logs:ro

  crowdsec-web-ui:
    container_name: crowdsec_web_ui
    image: ghcr.io/theduffman85/crowdsec-web-ui:latest
    restart: unless-stopped
    depends_on:
      - crowdsec
    networks:
      - crowdsec
    ports:
      - 127.0.0.1:3000:3000 # loopback only; NPMPlus proxies to it
    environment:
      - TZ=${TZ}
      - CONFIG_INSTANCE_NAME=proxy
      - CONFIG_INSTANCE_LAPI_URL=http://crowdsec:8080
      - CONFIG_INSTANCE_LAPI_AUTH_USERNAME=crowdsec-web-ui
      - CONFIG_INSTANCE_LAPI_AUTH_PASSWORD=${CROWDSEC_LAPI_PASSWORD}
      - CONFIG_INSTANCE_METRICS_URL=http://crowdsec:6060/metrics
      - CONFIG_UI_TIME_ZONE=${TZ}
      - CONFIG_UI_TIME_FORMAT=24h
    volumes:
      - ./crowdsec-web-ui/data:/app/data

networks:
  crowdsec:
    ipam:
      config:
        - subnet: 172.30.30.0/24 # must match trusted_ips in config.yaml.local
A few things worth calling out:
- The two
127.0.0.1port lines on CrowdSec stay exactly as they were. NPMPlus runs on host networking and reaches the LAPI and AppSec engine through them. Remove them and your bouncer goes blind. - The UI is published on
127.0.0.1:3000only. Because NPMPlus is on host networking, it can proxy straight to loopback. Nothing new is reachable from the LAN. - The UI reaches CrowdSec by name. Both are on the same user-defined network, so
http://crowdsec:8080resolves. That doesn’t work on Docker’s default bridge, which is why CrowdSec has to move.
Pitfall: Delete
network_mode: bridgefrom the CrowdSec service if you had it (my original walkthrough did). A service can’t have bothnetwork_modeandnetworks, and the deploy fails.
Note: The subnet stays in
compose.yamlrather than.envon purpose. CrowdSec’s config can’t read your stack’s.env, so you have to keep the two copies in step by hand anyway.
Step 6: Deploy and Check Nothing Broke
Deploy the stack in Dockge (or docker compose up -d). CrowdSec gets recreated because its network changed; NPMPlus is left alone.
Heads-up: The NPMPlus bouncer fails closed. While CrowdSec restarts, your sites return errors for a few seconds. I learned that the hard way in my WordPress migration post. Do this at a quiet time.
Then check the ports are loopback-only, and the network and trusted IPs took:
ss -tlnp | grep -E ':7422|:8080|:3000'
docker network inspect npmplus-crowdsec_crowdsec --format '{{range .IPAM.Config}}{{.Subnet}}{{end}}'
docker exec crowdsec cscli config show --key Config.API.Server.TrustedIPs
docker exec crowdsec cscli bouncers list
What each check should show:
- Ports:
127.0.0.1for all three, and nothing on0.0.0.0. - Network: your subnet.
- Trusted IPs: a list with your three entries.
- Bouncers: a fresh last-pull time for the NPMPlus bouncer.
Note: You’ll probably see a second bouncer appear, named something like
[email protected]. CrowdSec saw the same API key arrive from a new IP (the new network’s gateway) and auto-created an entry. It’s harmless. The old one just goes stale; leave it, or prune it later.
Step 7: Register the UI With CrowdSec
Create the machine account using the password from Step 3:
docker exec crowdsec cscli machines add crowdsec-web-ui --password 'your-password' -f /dev/null
docker restart crowdsec_web_ui
Important: Keep
-f /dev/null. Without it,cscliwrites the new credentials over CrowdSec’s own credentials file, and its agent stops being able to talk to its own LAPI.
The UI’s log shows it pulling history in 12-hour chunks. Mine grabbed about 4,900 alerts from the last week in a few seconds:
docker logs crowdsec_web_ui --tail 20
curl -s http://127.0.0.1:3000/api/health
docker exec crowdsec cscli machines list
The health check should return {"status":"ok"}, and the machine list should show crowdsec-web-ui with an IP from your new subnet and a recent heartbeat.
Step 8: Put It Behind Cloudflare Access, Then Publish It
This panel can add and remove bans, and its first-run page creates the admin account. It should never be reachable by the open internet, not even for a minute. Order matters.
8a. Cloudflare Access application first
In Cloudflare Zero Trust, go to Access → Applications → Add an application → Self-hosted. Use your dashboard hostname (I’ll use crowdsec.example.com) and attach the same policy your other admin panels use. Mine requires WARP, as covered in the front-door post.
8b. Tunnel route
In your tunnel’s Published application routes (older dashboards call them Public hostnames), add crowdsec.example.com:
| Setting | Value |
|---|---|
| Service URL | https://127.0.0.1:443 (NPMPlus, same as your other proxied sites) |
| TLS → Origin Server Name | crowdsec.example.com |
| TLS → Match SNI to host | On |
| Disable TLS certificate verification | Off |
| HTTP settings | Defaults |
Certificate verification stays on, which is the stricter option. It works because NPMPlus will present a real certificate for that hostname once the proxy host exists.
Note: If your admin panel for NPMPlus itself is routed to port
81, don’t copy that. Port 81 is NPMPlus’s own admin UI. The dashboard goes through a normal proxy host on443, like any other site.
Pitfall: Until you finish 8c, the hostname returns a Cloudflare 502. NPMPlus has no certificate for it yet, so cloudflared’s certificate check fails. Don’t chase it; it disappears as soon as the proxy host exists.
8c. NPMPlus proxy host
| Field | Value |
|---|---|
| Domain | crowdsec.example.com |
| Scheme | http |
| Forward host / port | 127.0.0.1 / 3000 |
| SSL | Your wildcard cert, Force SSL and HTTP/2 on |
No custom nginx config is needed. NPMPlus already passes the Host and X-Forwarded-Proto headers the UI needs for secure cookies and passkeys.
Step 9: First Login
Browse to https://crowdsec.example.com. Cloudflare Access checks you, then the UI shows its setup page. Create your admin account, then go straight to Settings and turn on TOTP. A passkey is a nice extra. Passkeys are tied to the hostname, so always use the same URL.
[Image placeholder: dashboard with the attack map and top scenarios]
[Image placeholder: Alerts page with an alert expanded, showing IP, country, ASN and the triggered rule]
Finally, prove that management works end to end. In Decisions, add a 5-minute ban on 192.0.2.123 (a documentation IP that’s safe to ban), then delete it, and delete the alert it created. If the alert delete gives you a 403, your trusted_ips didn’t load or doesn’t match the network subnet.
Note: By default the UI shows your own detections, not the community blocklist. That’s what you want, since CrowdSec’s community blocklist is tens of thousands of entries.
The Surprise: CrowdSec Wasn’t Reading My Logs
This is the part I didn’t expect, and honestly the most valuable thing to come out of the whole exercise.
As part of checking the deploy, I looked at CrowdSec’s acquisition metrics, the table showing which log sources it’s reading:
docker exec crowdsec cscli metrics show acquisitionThere was exactly one row: appsec:appsec. No NPMPlus access log, no error log. I gave it a few minutes in case it was just the restart. Still one row.
CrowdSec’s startup log said it plainly:
level=warning msg="No matching files for pattern /opt/npmplus/nginx/*.log" module=acquisition.fileAnd a listing inside the container showed why:
docker exec crowdsec ls /opt/npmplus/nginx/logs
# access.log  error.log  stream.log  ...
The logs are mounted into /opt/npmplus/nginx/logs/, but the acquisition config was looking one folder up, in /opt/npmplus/nginx/. That folder has no .log files in it, so CrowdSec found nothing and moved on with a single warning nobody reads.
What that actually meant
CrowdSec on NPMPlus works in two halves:
- AppSec (the WAF): NPMPlus sends each request to CrowdSec’s AppSec engine on port 7422, which blocks known exploit patterns inline. This half was working fine.
- Log-based scenarios: CrowdSec reads the access and error logs and spots behaviour: scanners walking through hundreds of paths, brute-force login attempts, 404 floods and so on. This half had nothing to read.
So every behaviour-based scenario had been blind since I set the stack up. The WAF kept blocking obvious exploits, which made everything look healthy. But anything that needed to watch traffic over time never fired.
The fix
One sed on the acquisition file, then a restart of CrowdSec. My file is crowdsec/conf/acquis.d/npmplus.yaml; yours may be named slightly differently.
sed -i 's#/opt/npmplus/nginx/\*\.log#/opt/npmplus/nginx/logs/*.log#' crowdsec/conf/acquis.d/npmplus.yaml
docker restart crowdsec
The corrected file:
filenames:
  - /opt/npmplus/nginx/logs/*.log
labels:
  type: npmplus
---
filenames:
  - /opt/npmplus/nginx/logs/*.log
labels:
  type: modsecurity
---
listen_addr: 0.0.0.0:7422
appsec_config: crowdsecurity/appsec-default
name: appsec
source: appsec
labels:
  type: appsec
The *.log pattern picks up access.log, error.log and stream.log, and skips the rotated .1, .2 files.
Give it a minute, then check:
docker logs crowdsec --since 2m 2>&1 | grep -iE 'No matching files|Adding file'
docker exec crowdsec cscli metrics show acquisition
You want to see Adding file /opt/npmplus/nginx/logs/access.log to datasources, and file:/opt/npmplus/nginx/logs/access.log rows in the metrics with lines read climbing.
Note: A warning about
/does/not/existis a harmless placeholder in the image’s defaultacquis.yaml. Ignore it.
Note: Don’t panic about the “Lines unparsed” count. The config reads each file twice, once as
npmplusand once asmodsecurity. Each parser only understands its own kind of line, so every line is “unparsed” by one of them. That’s by design.
Important: If you followed my NPMPlus migration walkthrough, it had this same wrong path. I’ve corrected it there too. Run the
cscli metrics show acquisitioncheck above even if you never install the dashboard; it takes ten seconds.
The irony isn’t lost on me: I set out to see what CrowdSec was doing, and the first thing I saw was that half of it wasn’t doing anything.
Step 10: Notifications to ntfy
The UI has a proper Notification Center. Under Notifications → Destinations, add an ntfy destination: your ntfy server URL, a topic (I use crowdsec), and an access token if the topic needs one. Then hit Send Test.
Then pick rules carefully. On a public-facing proxy, some of them will happily notify you every thirty seconds. These are the ones I run:
| Rule | Setting | Tells you |
|---|---|---|
| LAPI Availability | Outage over 5 min, recovery notice on | CrowdSec has stopped responding |
| Alert Spike | e.g. +200% and at least 20 alerts | Something is actively hammering you |
| Recent CVE | Default | Someone is probing a freshly published CVE |
| Application Update | On | A new web UI release is out |
I’d leave IP Ban and New Alert/Decision off, at least to start. They fire on every single event.
Pitfalls I Hit (So You Don’t Have To)
Renaming the stack folder took my sites down. Halfway through, I decided npmplus wasn’t a descriptive enough stack name and renamed the folder in /opt/stacks/. Dockge then showed a new inactive stack and the old one as exited. The old containers were still labelled with the old Compose project name, and nothing was running my reverse proxy. If you rename a stack:
- Remove the old containers. Your data is in the bind mounts, so it’s safe.
docker ps -a --filter label=com.docker.compose.project=OLD_NAME docker rm npmplus crowdsec - Change
name:at the top of the compose file to match the new folder name. - Deploy.
If your containers have fixed container_names like mine, all your docker exec commands and cron jobs keep working. The Docker network name does change, though: it becomes newname_crowdsec.
Other things to watch for:
| Symptom | Cause | Fix |
|---|---|---|
Deploy fails with a network_mode conflict | network_mode: bridge still on CrowdSec | Delete that line |
| CrowdSec keeps restarting | YAML error in config.yaml.local | docker logs crowdsec names the line |
| UI log shows 401 from the LAPI | .env password doesn’t match the machine | Re-run cscli machines add, restart the UI |
| Alert delete returns 403 | trusted_ips not loaded, or wrong subnet | cscli config show --key Config.API.Server.TrustedIPs |
| UI container restarting, SQLite errors | Data folder owned by root | chown -R 1000:1000 crowdsec-web-ui/data |
| Metrics page empty | Prometheus still on 127.0.0.1 | Check the prometheus block in config.yaml.local |
| Cloudflare 502 on the new hostname | Proxy host or certificate missing in NPMPlus | Finish Step 8c |
Useful Commands
# What's CrowdSec actually reading?
docker exec crowdsec cscli metrics show acquisition

# Bans, alerts, bouncers, machines
docker exec crowdsec cscli decisions list
docker exec crowdsec cscli alerts list
docker exec crowdsec cscli bouncers list
docker exec crowdsec cscli machines list

# Web UI health and logs
curl -s http://127.0.0.1:3000/api/health
docker logs crowdsec_web_ui --tail 50
Wrapping Up
What I wanted was a list of what CrowdSec was blocking. What I got:
- A dashboard I actually open: it shows exactly what’s hitting my proxy, from where, and which rule caught it.
- Unbans from my phone: no more SSH-ing in at 2am to lift a ban on myself. Spotting AppSec false positives, like the one behind my Invoice Ninja logout saga, is now a few clicks instead of an evening of log reading.
- Nothing new exposed: no new ports on the LAN, and the UI sits behind Cloudflare Access and its own TOTP login.
- The real win: CrowdSec reading my logs again, with half its detection back on after months of being blind.
If you take one thing from this post, make it this: run cscli metrics show acquisition on your own CrowdSec today. A security tool that’s quietly not reading its inputs looks exactly like one that’s working, right up until you check.
Leave a Reply